The Experience Profiles are a powerful tool for creating engagement through personalization. Engaging attendees as co-creators of their experience forges a relationship. Entering into a dialog with the brand or organizer, attendees connect with the intent of the experience.
This connection shapes brand perception but more importantly generates a relationship between event creator and attendee that is built around a shared, vested, interest in success.
“When you leave room for people to co-create, you are creating fans. The co-creators are vested in the success of the outcome.”
- Heidi Neck, PhD, author of Entrepreneurial Practice + Mindset
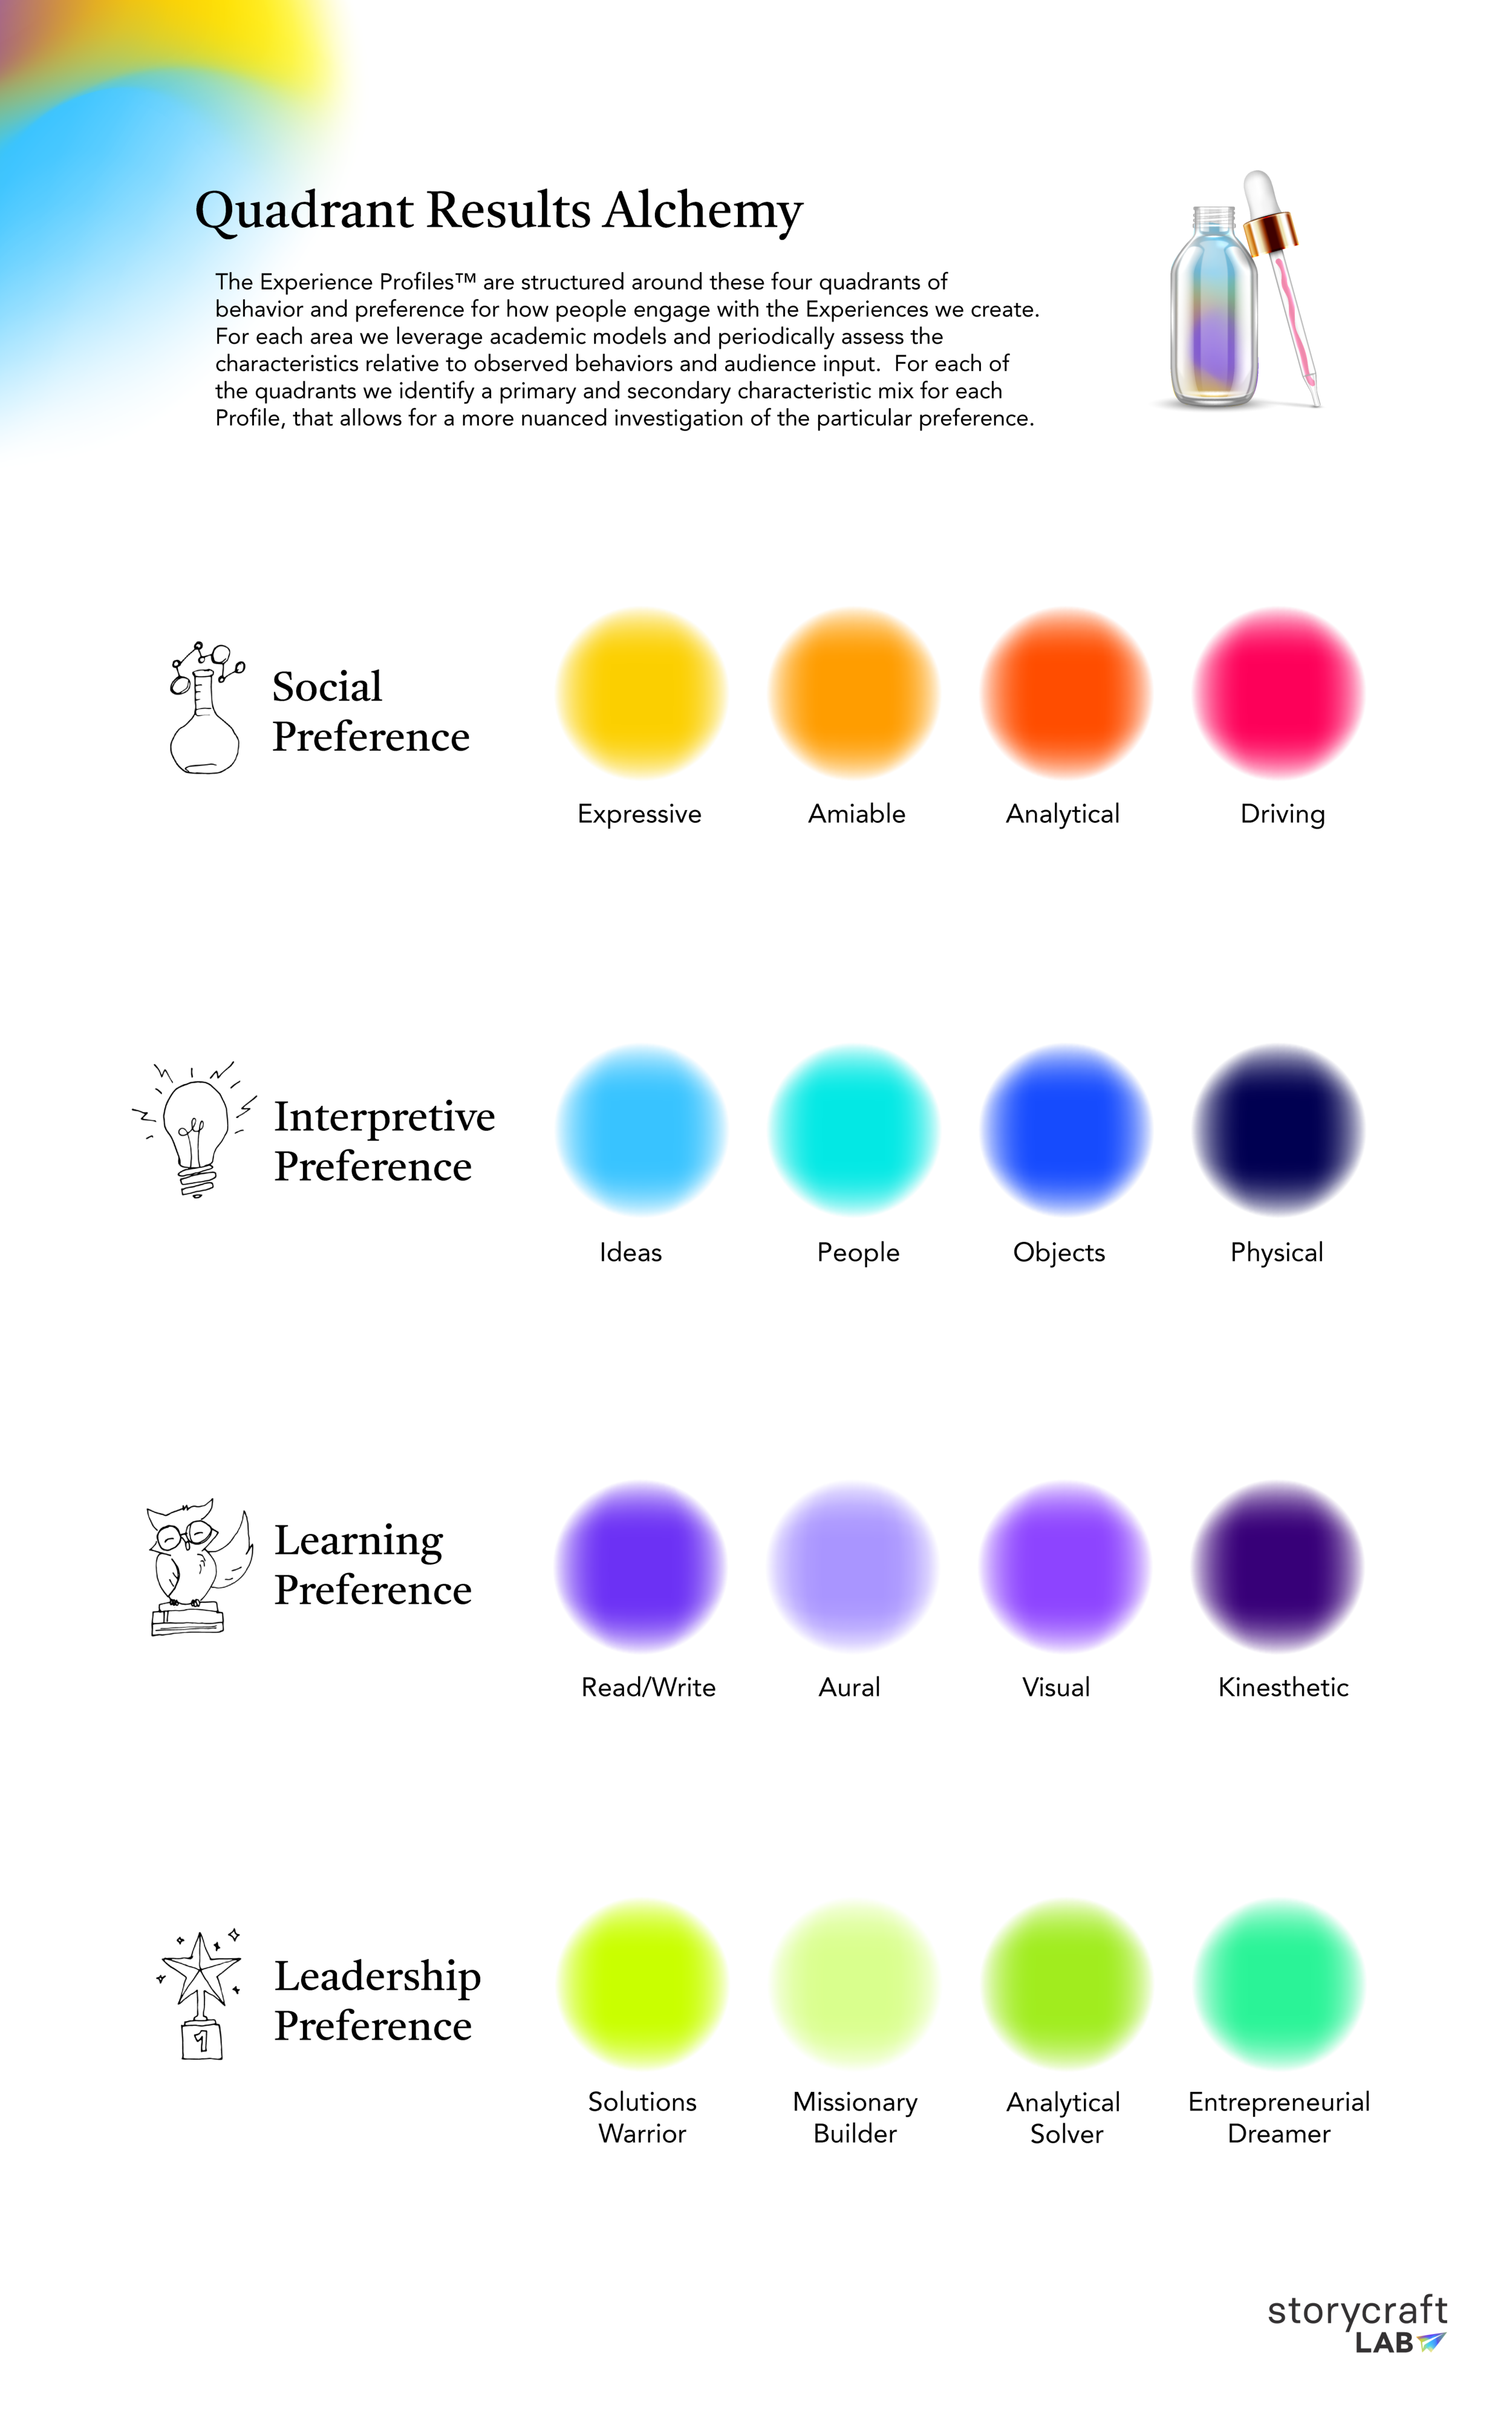
The Experience Profiles™ are structured around four quadrants of behavior and preference for how people engage with the Experiences we create: Social, Interpretive, Learning and Leadership.
For each area we leverage academic models and periodically assess the characteristics relative to observed behaviors and audience input.
The framework has the capacity for flexibility and customization for specific audience groups as we can lean more heavily into any of the four quadrants according to the nature of the event and the attendees.
The Quadrants in Detail
Social Preferences are important for how we consider experiences in the context of our interactions with others. Across all aspects of experience engagement, how we prefer to interact, influence and share (or not) experiences with others, shapes how we choose to engage with content, message, and brand. We refer to the work of Merill and Reid, psychologists whose work identify 4 social preferences: Amiable, Expressive, Analytical and Driving.
-
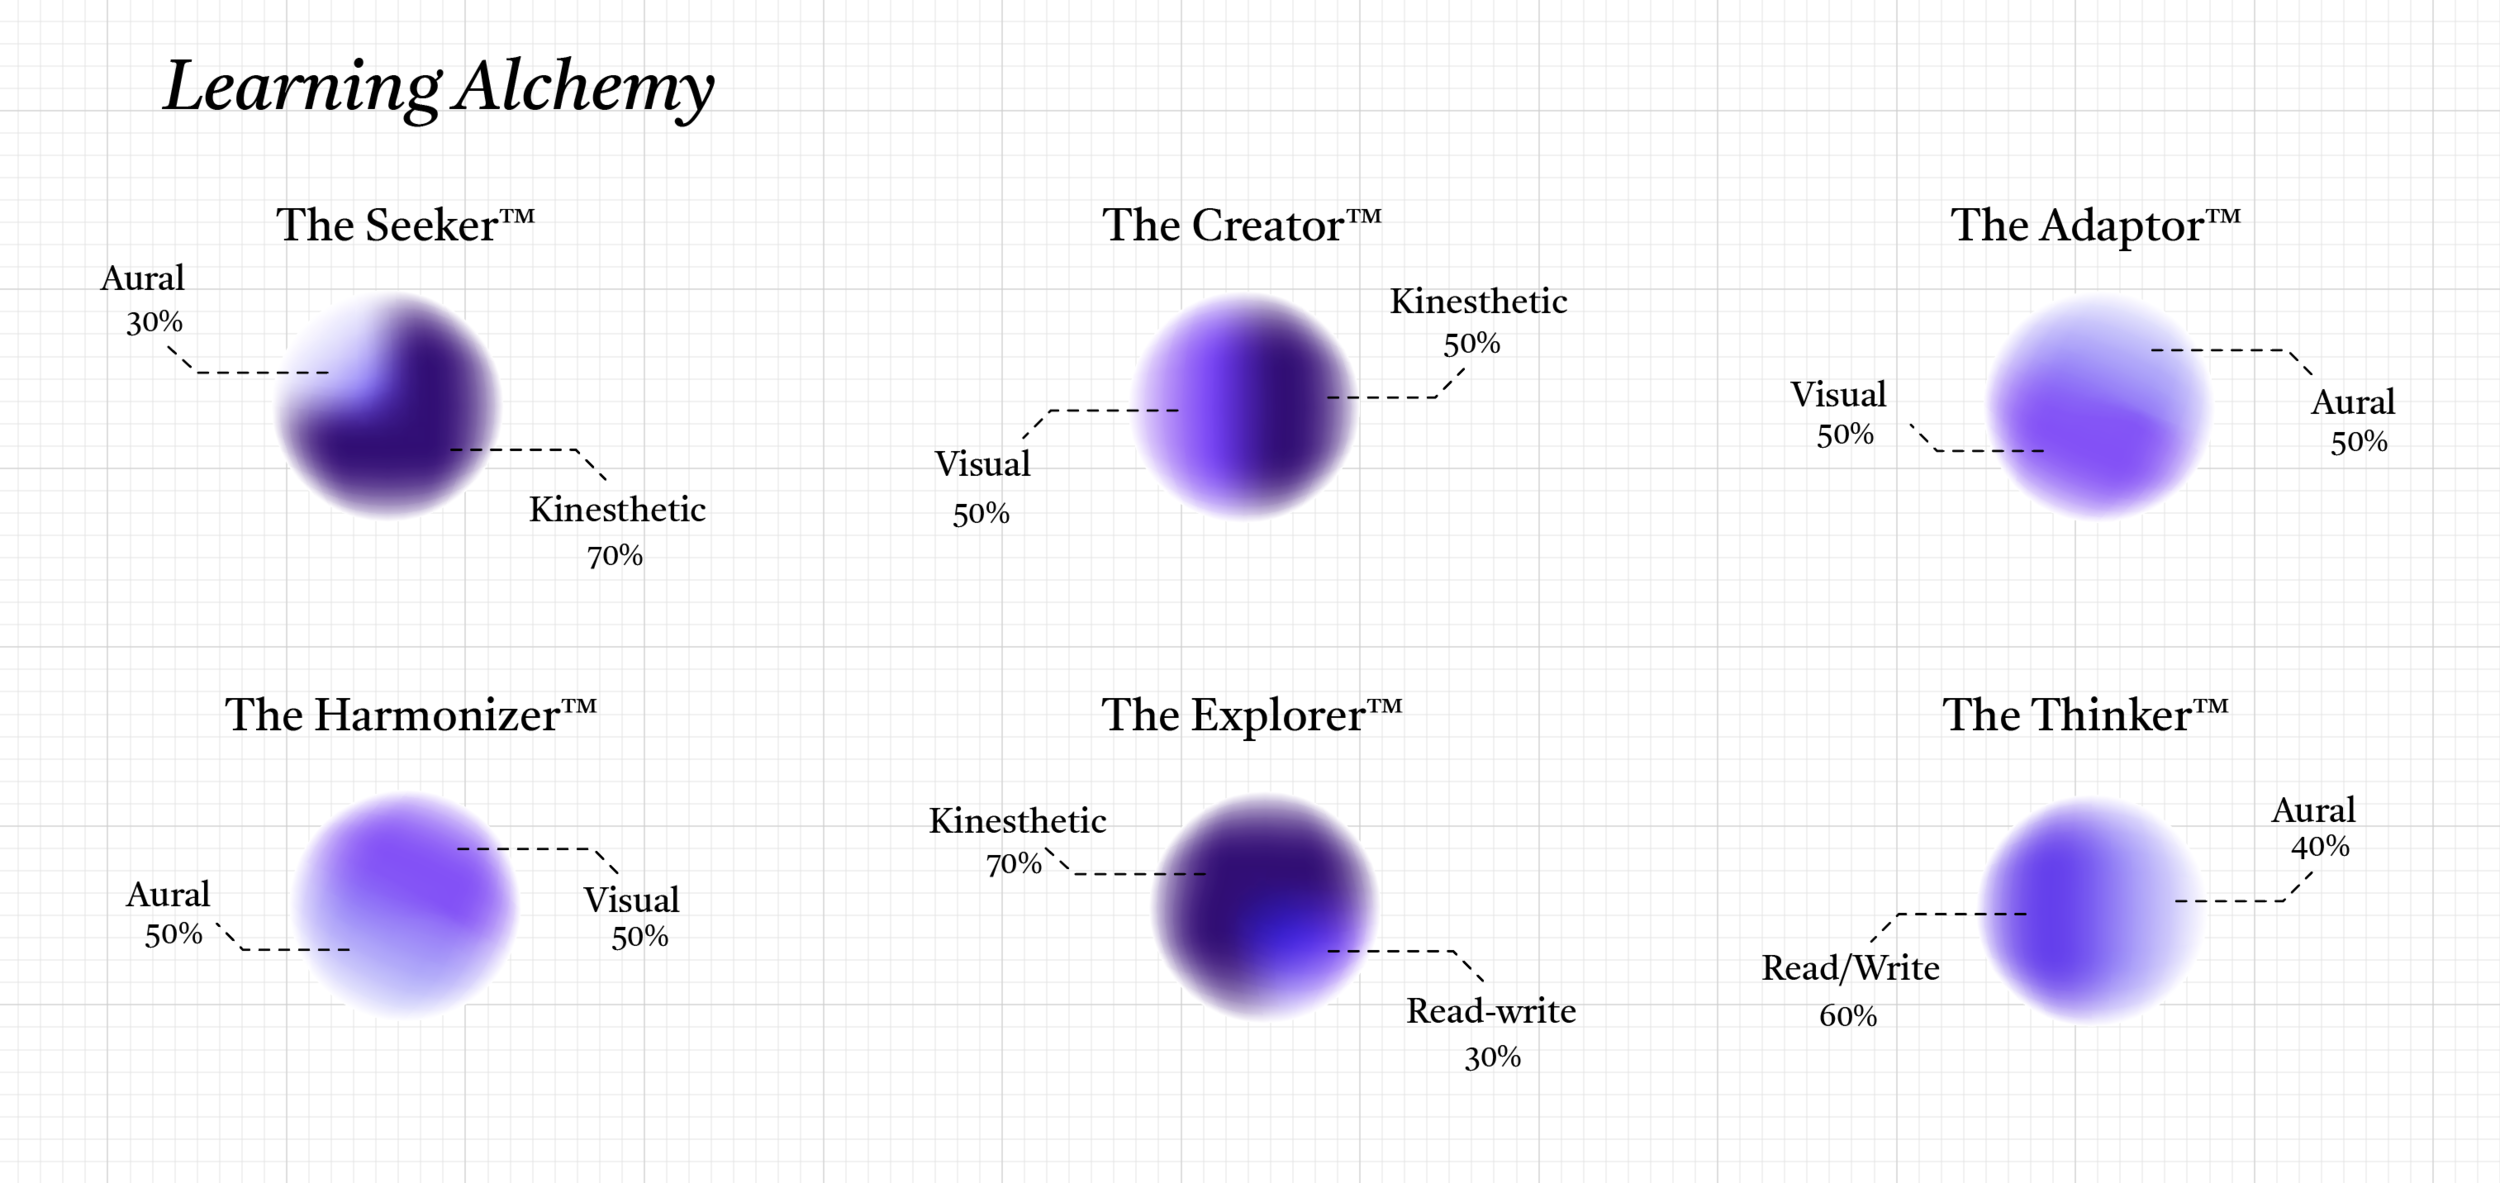
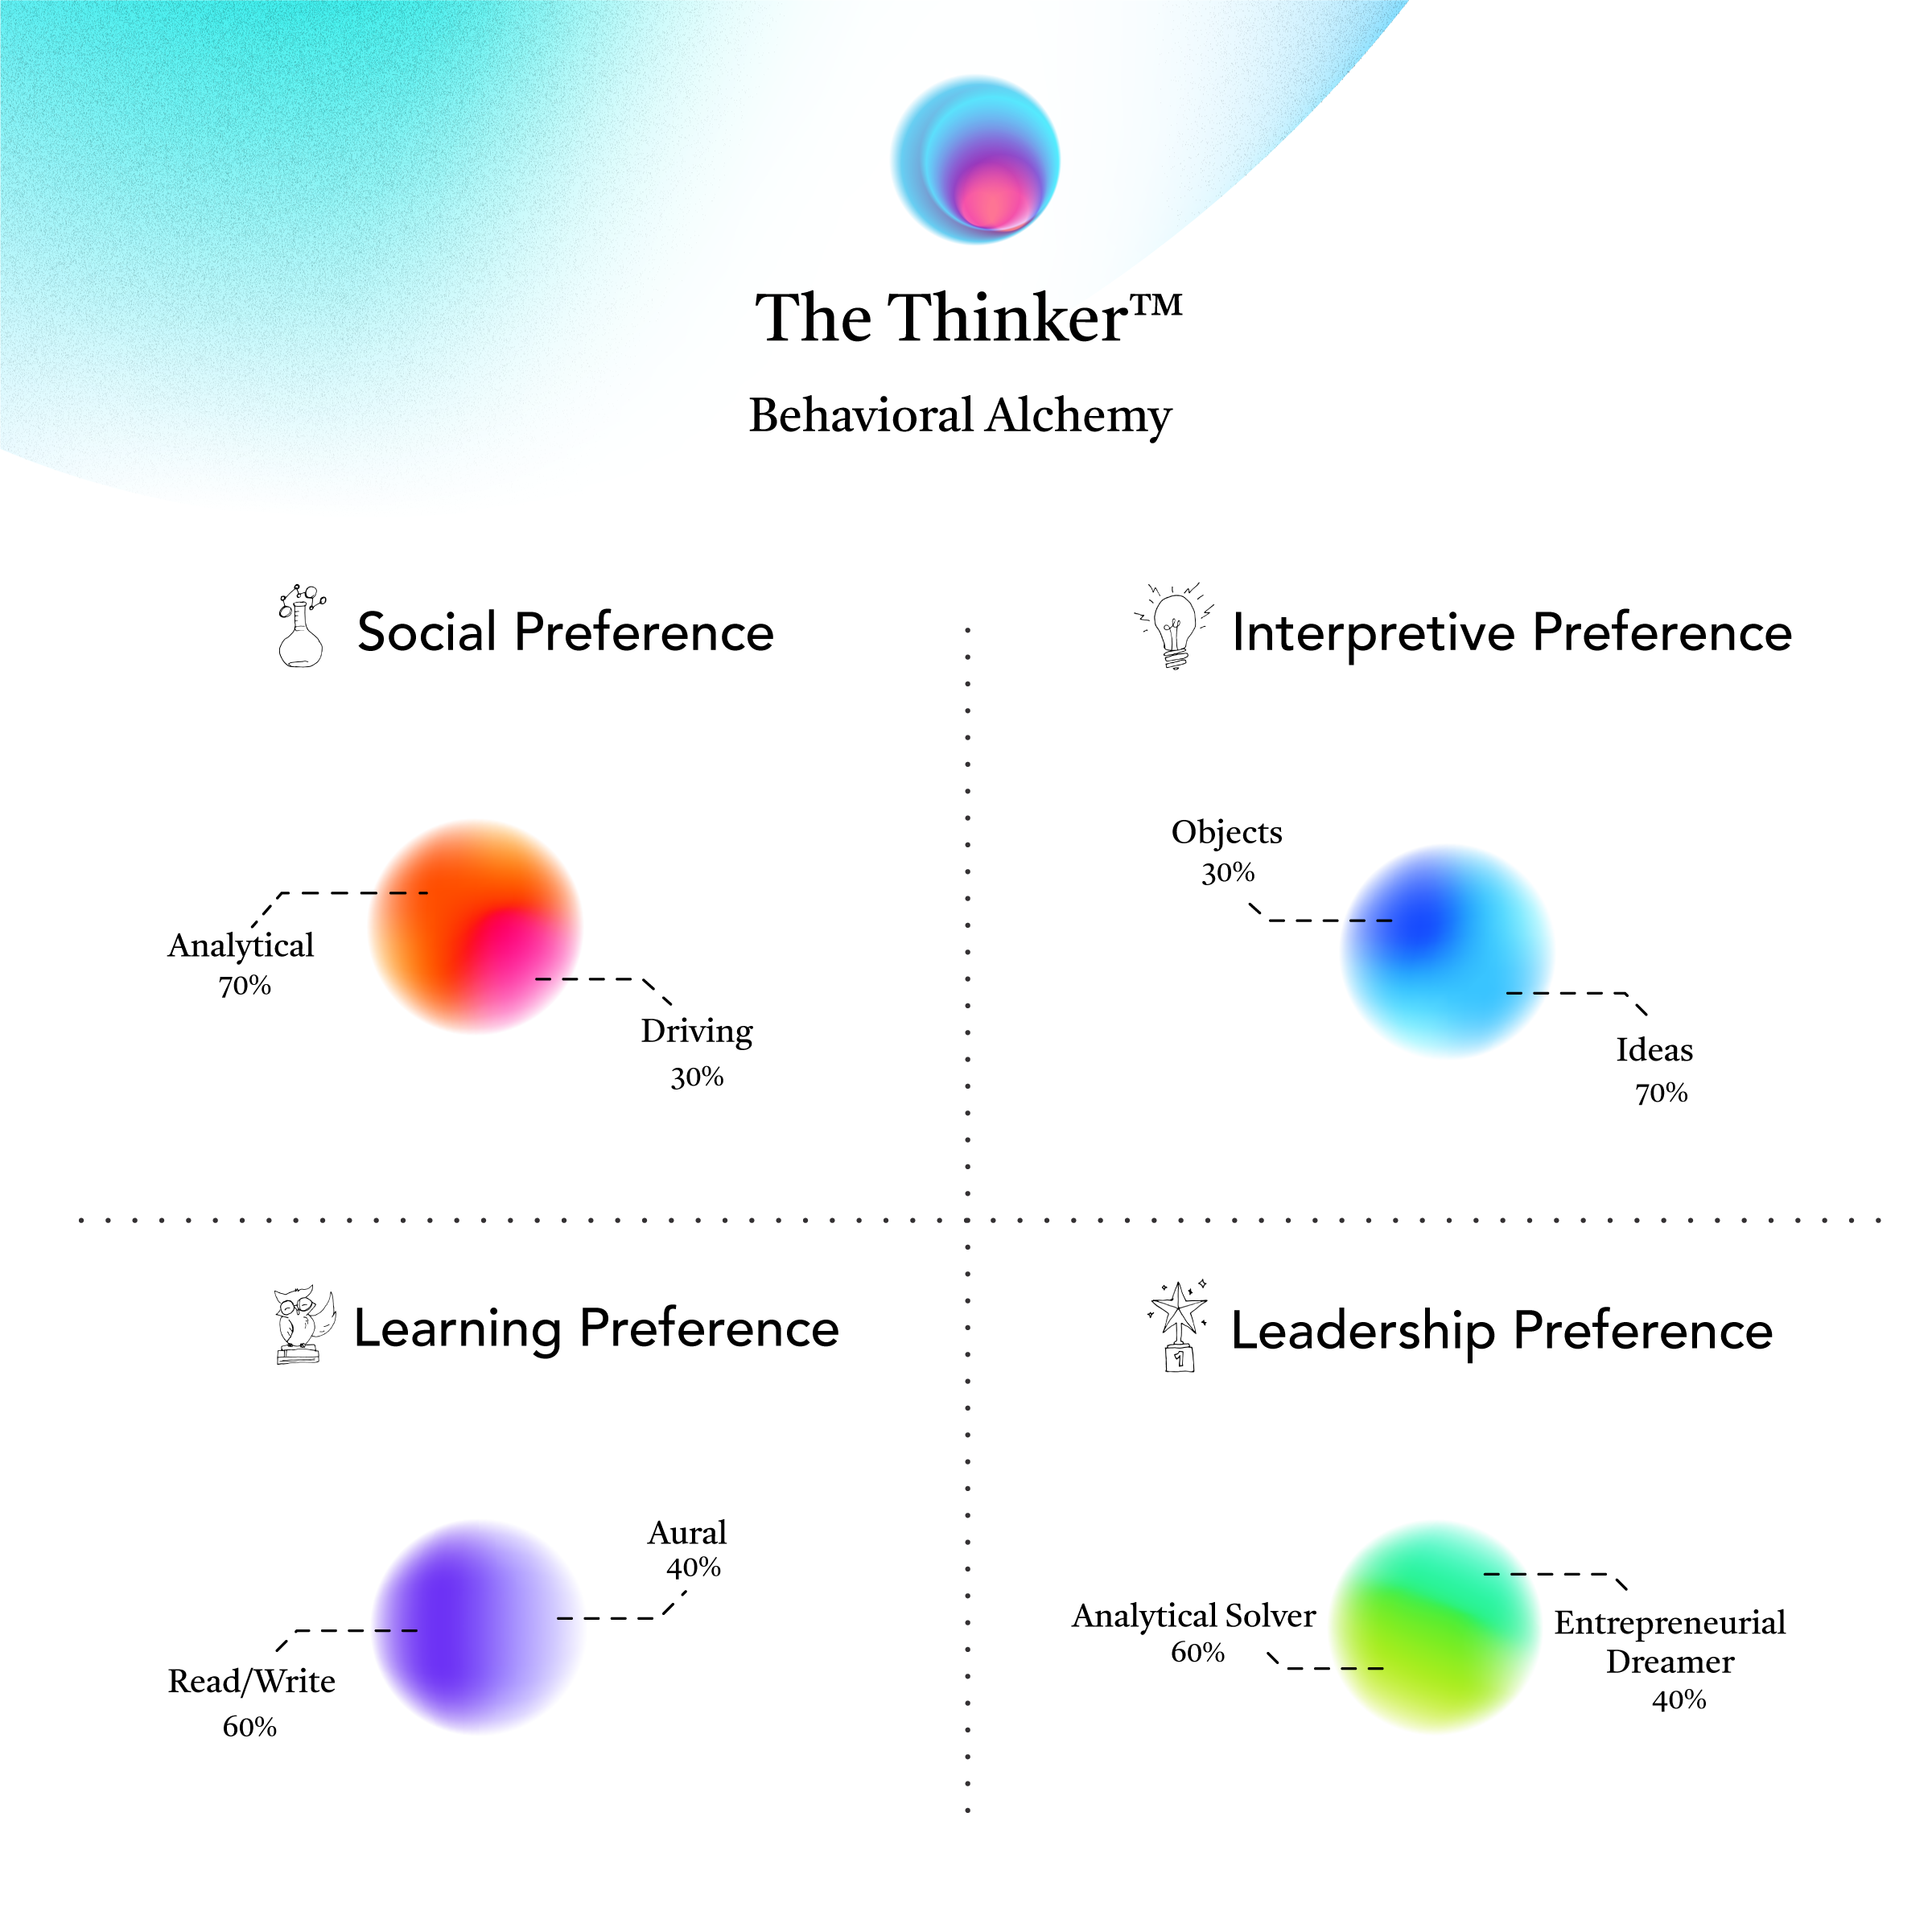
For each of the quadrants we identify a primary and secondary characteristic mix for each Profile, that allows for a more nuanced investigation of the particular preference. For Example, the Creator’s social preference is primarily Amiable, secondarily Driving.
Interpretive Preferences are about how we connect to and make meaning from the information that we encounter within experiences. What attracts us to an experience? And once we are there, what resonates, causes us to form an opinion? What type of content is most likely to shift our perspective, cause us to change our behavior or commit to an action? The act of interpretation is how we synthesize the content we are being provided, prioritize what we recall and share, and ultimately determine how it applies - whether that is to the project at hand, or to our world view, or our lives.
The Smithsonian Office of Audience Research (SOAR) pioneered the IPOP theory preferences for better understanding visitors and visitors experiences as: IDEAS, PEOPLE, OBJECT, PHYSICAL.
-
The IPOP theory recognizes the individual experiences of museum visitors and identifies key subsets of a general audience base. The acronym IPOP stands for types of exhibition content individual visitors are particularly drawn to:
IDEA people are drawn to big ideas that shape content
PEOPLE people are drawn to stories and representations of people (and they enjoy the social experience of a museum visit)
OBJECT people are drawn to the “real things”, the objects within the exhibition.
PHYSICAL people are drawn to the physical space and haptic experience of the exhibition
Learning Preferences provide an understanding of what we are drawn to which provides attendees with a lens to craft their educational journey. It also provides Experience Content Designers information to ensure inclusive learning options, and create supporting materials that appeal to all attendee preferences. The model we look to as we consider Learning Preferences uses Fleming & Mills theory on the VARK modalities (1992). Fleming and Mills defined the preferences as follows: “Visual (V), “Aural (A), “Read/Write (R) “Kinesthetic (K).
-
An understanding of Aural, Visual, Verbal, Kinesthetic and Social learning preferences provides attendees with a lens to craft their educational journey. It provides Experience Content Designers information to ensure inclusive learning options, and create supporting materials that appeal to all attendee preferences. The model we look to as we consider Learning Preferences uses Fleming & Mills theory on the VARK modalities (1992).
Fleming and Mills defined the preferences as follows:
“Visual (V) preference for graphical and symbolic ways of representing information . Preference includes diagrammatic material often used by teachers to symbolize information (e.g., graphs, charts, flow charts,models, and all the symbolic arrows, circles, hierarchies and other devices used by teachers to represent what could have been printed information”
“Aural (A), describes a preference for "heard" information. Students who prefer aural forms of information dissemination report that they learn best from lectures, tutorials, and discussion with other students and faculty.”
“Read/Write (R) preferences for information largely composed of printed words from which some students appear to get a greater or lesser degree of understanding.”
“Kinesthetic (K), defined as the perceptual preference related to the use of experience and practice (simulated or real)."
Leadership Preferences In selecting the academic framework reference for Leadership preferences, we encountered the most significant diversity of frameworks available. We looked for systems that did not infer negative typing or statements of fact around the ‘most’ or ‘least’ effective leadership preferences. Instead we approached the idea of leadership from both the leader perspective, and from the team’s perception of a leader. We were aware that as we look to generational shifts, Leadership preferences are an area we see the most evolution and flux*. As a result we drew upon three sources to shape the preference sets that all speak to traits that include emotional intelligence, values and mission-centric thinking.
Like the other preference quadrants, Leadership is a place where a nuanced self-awareness of preference means that Leaders can excel by making sentient choices to best respond to their strengths, their teams and the situation at hand. Armed with self and situational awareness, leaders can craft their own adaptive leadership strategies through practice and mentorship - again underscoring how the use of preference is not a typing activity, but rather a tool for self-driven growth and development.
-
*“We know that Millennials represent the majority of the workforce. And we know they are our leaders of today, with 44 percent of Millennials in leadership positions (Deloitte, 2017). When we take into account the change in workplace demographics, it’s clear that our leaders are changing–and so are their preferences. Millennials view leadership development programs differently than their Boomer counterparts, with only half of Millennials seeing strong alignment between program content and business issues facing the organization. Boomers responded quite differently, with 75 percent feeling that program content is aligned with business issues (Harvard Business Publishing, 2018).”
The Alchemy
Building the Profiles
The Experience Profiles™ are created around unique combinations of scores in the four quadrants of social, interpretive, learning and leadership behaviors and preferences. As we build the profiles we also consider the characteristics for each quadrant with nuance, returning a primary and secondary set of preferences:
This approach allows for greater diversity and pushes beyond binary fixed definitions. The Experience Profiles™ can be interpreted as more malleable, changeable according to context. This provides the end user with more to consider, reflect and build upon - a foundation for engagement and co-creation.
-
The result of the nuance intentionally built into the alchemy behind the profiles means that there are many, many, variations of the preferences that could be returned. So the six Experience Profiles - The Seeker, The Creator, The Adaptor, The Harmonizer, The Explorer and The Thinker - represent segments of the variations that group similarities in preference and behavior together. This is why it’s important to emphasize that the Experience Profiles(™) are not a fixed or definitive typing tool. They are a tool to prompt a sentient self awareness, reflection and activation by the attendee; and the offering of a diversity of preference pathways by the creators of inclusive experiences.


